Key facts and figures about the area
South Gloucestershire is largely rural in area but most of its population lives within the fringe of Bristol.
Over 40% of South Gloucestershire is covered by the green belt (green space) which surrounds and separates Bristol and Bath. It covers an area of 536.5 km2 and has a population of 290,423 as of the 2021 Census.

Open the infographic (PDF) full screen in a new tab
| South Gloucestershire | England | |
| Population (mid-year estimates, 2023) | 299,439 | 57,690,323 |
| Median age (Census, 2021) | 40 | 40.5 |
| Proportion of black and minority ethnic residents (Census, 2021) | 8.8% of total population | 19% of total population |
| Non-UK born residents (Census, 2021) | 10.6% of total population | 17.4% of population |
The data for these statistics comes from the 2021 Census, Office for National Statistics (ONS) and South Gloucestershire Economic Briefing.
Interactive data on your local area
Use ONS’s build a custom area profile to view key information about South Gloucestershire. You can enter your postcode to view your local area.
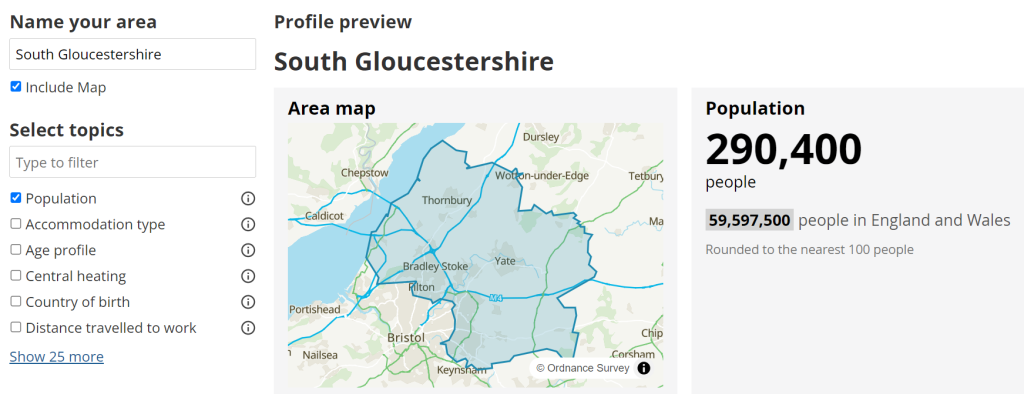
Population (2021 Census)
South Gloucestershire has seen a 10.5% increase in residents since 2011.
Its growth in population over the last 10 years is higher than all of its neighbouring authorities, Bristol, Bath and North East Somerset, North Somerset and Gloucestershire (ONS).
The median age of residents of is 40. Like elsewhere in the country the population is aging.
Since 2011 there has been a 22% increase of people aged 65 years and over. There has been an 8% decrease in those aged 15 to 19, an 8% decrease in those aged 40 to 44, and a 7% decrease in those aged 45 to 49.
As of 2021, 8.8% of the district’s population were of black and minority ethnic origin.
In 2021, 30,643 (10.6%) residents of South Gloucestershire were born outside of the UK.
The top 5 non-UK countries of birth of residents are Poland, India, ‘other EU countries’, Romania and Germany and other EU countries (Nomis).
If you cannot expand the section above, try refreshing your browser.
More information
For more information on South Gloucestershire, visit our local information and statistics pages.
You can also find our Population Health Intelligence Portal.